Neurofilament Light Chain – Biomarker of High Translational Value
Biomarkers and their use in neurodegenerative disease research delineates a rising area of research and may provide an important link between preclinical disease models and evaluation of disease progression in patients.
Neurofilament light chain (NF-L), a neuronal cytoplasmic protein, is increased in a variety of neuronal diseases due to axonal damage.
A strong increase of NF-L levels was found in Amyotrophic Lateral Sclerosis patients (Gaetani et. al, 2018). Therefore, NF-L levels were investigated in the low copy transgenic mouse model SOD1-G93A. Increased plasma NF-L levels were observed already at an age of 24 weeks, reaching significance with 27 weeks (Fig. 1).
In the familial Alzheimer’s disease mouse model 5xFAD, an increase in plasma NF-L levels can be observed already at an age of 6 months (Fig. 2A). Additionally, strongly elevated CSF NF-L levels can be detected in 5xFAD mice at the age of 9 months (Fig. 2B). Further mouse lines were characterized by Scantox as published in Loeffler et al. 2020.
Moreover, Scantox regularly participates in the Alzheimer’s Association external quality control program for cerebrospinal fluid biomarkers, measuring NF-L in human samples (Mattsson et al., 2013).
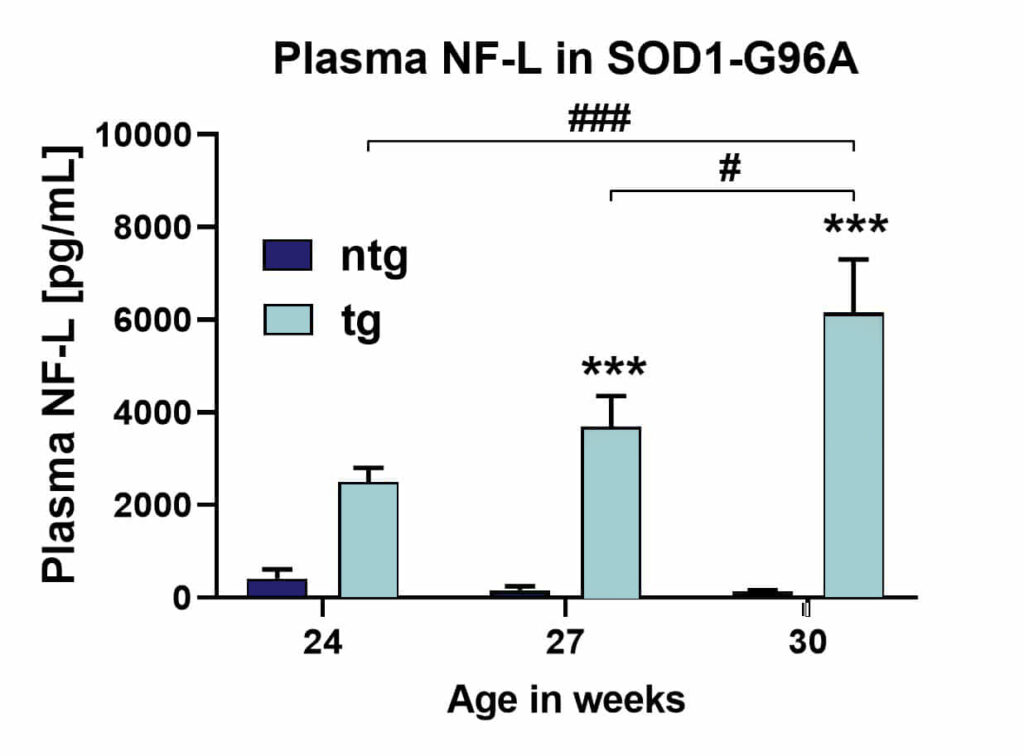
Figure 1: Quantification of neurofilament light chain in plasma of low copy SOD1-G93A mice.
NF-L levels in pg/mL in the plasma of 24, 27 and 30 week old SOD1-G93A mice compared to non-transgenic littermates (ntg). Two-way ANOVA with Tukey’s post hoc test. Mean + SEM. *p<0.05; ***p<0.001. *compared to ntg; # differences between age groups.
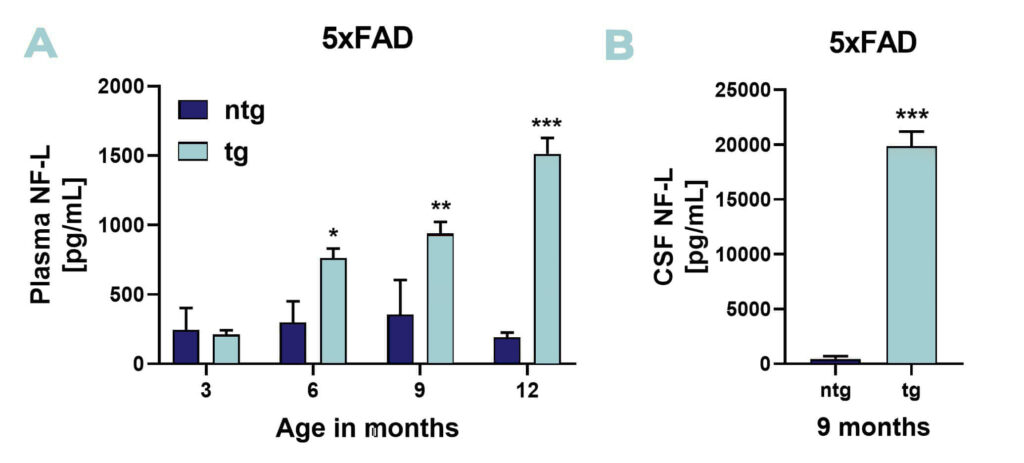
Figure 2: Quantification of neurofilament light chain in plasma and CSF of 5xFAD mice. A: NF-L levels in pg/mL in the plasma of 3, 6, 9 and 12 month old 5xFAD mice compared to non-transgenic littermates (ntg). Two-way ANOVA with Bonferroni‘s post hoc test. B: NF-L levels in pg/mL in the CSF of 9 months old 5xFAD mice compared to ntg. Unpaired t-test. A and B: Mean + SEM. *p<0.05; **p<0.01; ***p<0.001.